- 8 Eleven Building, 3rd Floor,Thimphu.
- australiajogay@gmail.com
- 9:30am - 5:00pm
Weather in Australia
- Home
- Weather in Australia
Temperature
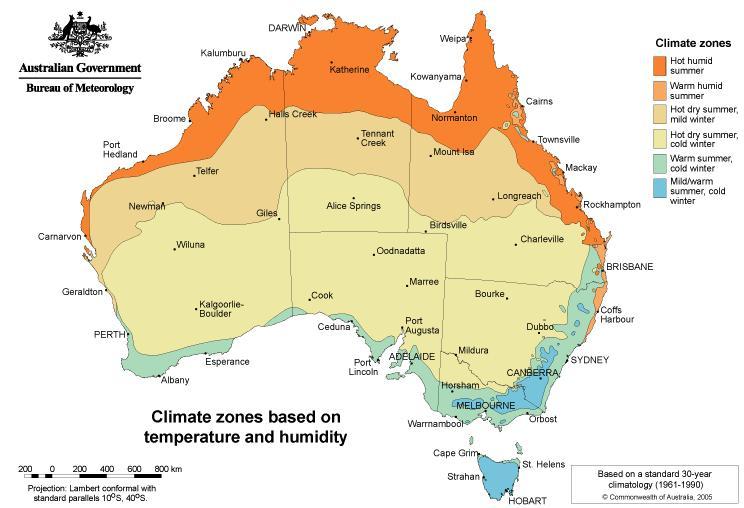
Australia has a relatively warm climate. Australia’s climatic zones are shown as below from the Bureau of Meteorology

This map indicates that summers(December to February) tend to be hotter and more humid in the north and winters(June to August) are usually colder in the south. These temperature differences are revealed in the average temperatures for Australia’s capital cities in this table (from the Australian Bureau of Statistics)
| JANUARY | JULY | |||
|---|---|---|---|---|
| AUSTRALIAN CITY | Max (°C) | Min (°C) | Max (°C) | Min (°C) |
| Adelaide (SA) | 28.7 | 16.8 | 15.2 | 7.4 |
| Brisbane (Qld) | 29.2 | 21.2 | 20.6 | 9.5 |
| Canberra (ACT) | 27.7 | 13.3 | 11.5 | -0.1 |
| Darwin (NT) | 31.8 | 24.8 | 30.7 | 19.4 |
| Hobart (Tas) | 21.8 | 12.5 | 12.2 | 4.7 |
| Melbourne (Vic) | 25.8 | 15.4 | 13.9 | 6.8 |
| Perth (WA) | 31.9 | 17.2 | 17.9 | 8.4 |
| Sydney (NSW) | 26.1 | 19.4 | 17.2 | 8.6 |
Overall Australian cities tend to have mild climates. The following average temperatures have been compiled from the World Meteorological Organization:
| SUMMER | WINTER | |||
|---|---|---|---|---|
| WORLD CITY | Max (°C) | Min (°C) | Max (°C) | Min (°C) |
| Sydney (Australia) | 26.1 | 19.4 | 17.2 | 8.6 |
| London (England) | 22.3 | 13.7 | 7.2 | 2.4 |
| New York (USA) | 28.2 | 20.1 | 3.1 | -3.9 |
| Auckland (New Zealand) | 23.6 | 15.9 | 14.0 | 6.9 |
| Toronto (Canada) | 26.4 | 17.9 | -1.1 | -7.1 |
Rainfall
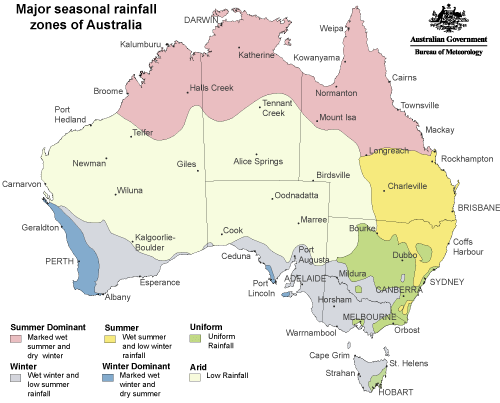
Australia has a low average annual rainfall but high falls occur in the north. The rainfall zones are shown below from the Bureau of Meteorology:

This map shows that northern and eastern regions have wet summers and that central Australia is very dry. This is revealed in the data of the rainfall in Australian cities as listed below (from the Australian Bureau of Statistics). It is clear that Darwin in the tropical north has the highest summer rainfall and highest annual rainfall and Perth has the highest winter rainfall.
| CITY | SUMMER Dec / Jan / Feb |
AUTUMN Mar / Apr / May |
WINTER Jun / Jul / Aug |
SPRING Sep / Oct / Nov |
TOTAL (mm) |
|---|---|---|---|---|---|
| Adelaide | 59.9 | 129.8 | 227.6 | 129.4 | 546.7 |
| Brisbane | 452.5 | 349.7 | 150.4 | 237.6 | 1190.2 |
| Canberra | 166.8 | 144.2 | 134.0 | 185.0 | 630.0 |
| Darwin | 1106.9 | 503.9 | 10.1 | 226.1 | 1847.0 |
| Hobart | 143.8 | 124.7 | 150.4 | 147.6 | 566.5 |
| Melbourne | 162.5 | 150.9 | 148.3 | 192.9 | 654.6 |
| Perth | 38.1 | 145.2 | 416.9 | 147.4 | 747.6 |
| Sydney | 340.6 | 388.9 | 288.4 | 258.6 | 1276.5 |
